Ten years on Oxford Street: a decade of change on one of Britain’s best-known shopping streets
Date published: 2023-03-29 Date modified: 2023-08-16
In terms of data, Oxford Street represents something of an extreme compared to wider national retail, historically having one of the most extensive retail offerings, highest levels of footfall and largest international customer base. Through changes in recent years, the street has seen challenges because of precisely this; its host of fashion and department store retailers and international appeal have made it susceptible to wider market difficulties.
Looking back on the ten years of data we have on the GB retail and leisure market, we examine how Oxford Street has changed over a decade.
Vacancy rates
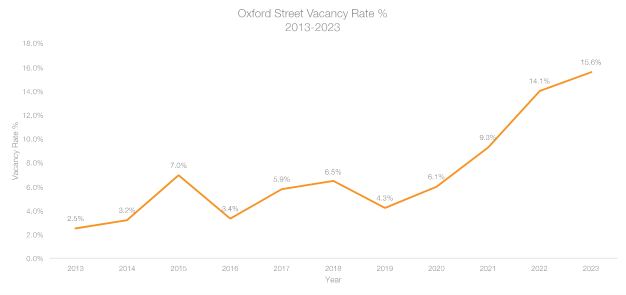
Figure 1: Oxford Street vacancy rate, 2013-2023 (Source: Local Data Company)
Then:
Historically, vacancy rates here have been low compared to national averages, tracking at only 2.5% in 2013. This increased to 7% in 2015, but then proceeded to decline again and remain low for some years. Despite having some of the highest rents per square foot, the area has long been highly desirable for occupiers as an opportunity for high levels of footfall and visibility.
Now:
The impacts of major brand administrations, COVID-19 restrictions on domestic and international visitors and other economic pressures have driven a sharp rise in Oxford Street’s vacancy rate since 2019. By 2021, the vacancy rate had reached 9.3%, the highest level the street has seen in over 7 years. Vacancy on Oxford Street continues to rise— currently it has surpassed the previous year’s peak of 14.1% to reach 15.6%.
Business type mix
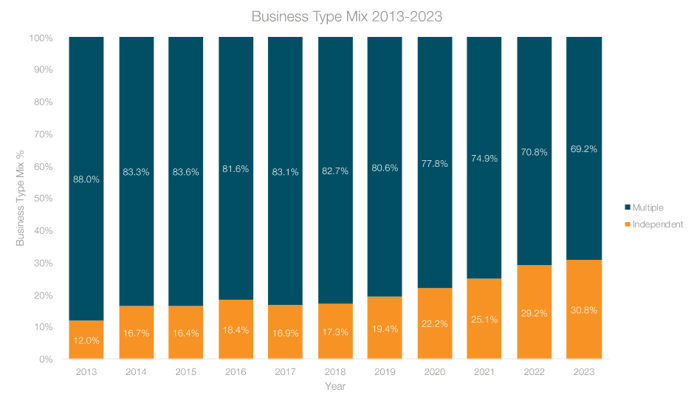
Figure 2: Multiple-independent mix for Oxford Street, 2013-2023 (Source: Local Data Company)
Then:
In 2013, only 12% of businesses on Oxford Street were independently-run. However, things were already starting to change ten years ago— the percentage of multiples dropped by -4.7% in the year to 2014. Multiple mix has continued to drop almost every year (with the exception of 2015 and 2017), driven by closures in the clothing and mobile phone categories.
Now:
Independents now represent 30.8% of the business mix on Oxford Street, having grown by 18.9% since 2013. This somewhat echoes the nationwide trend in independent growth seen in recent years, but the boom in independent businesses on Oxford Street looks rather different
There have been openings within the cafés and take-away food shops categories, but the growth of independents has been mainly driven by the boom in candy, gift and souvenir shops, a concerning trend that continues to pose a threat to economic and retail health.
Retail Categories
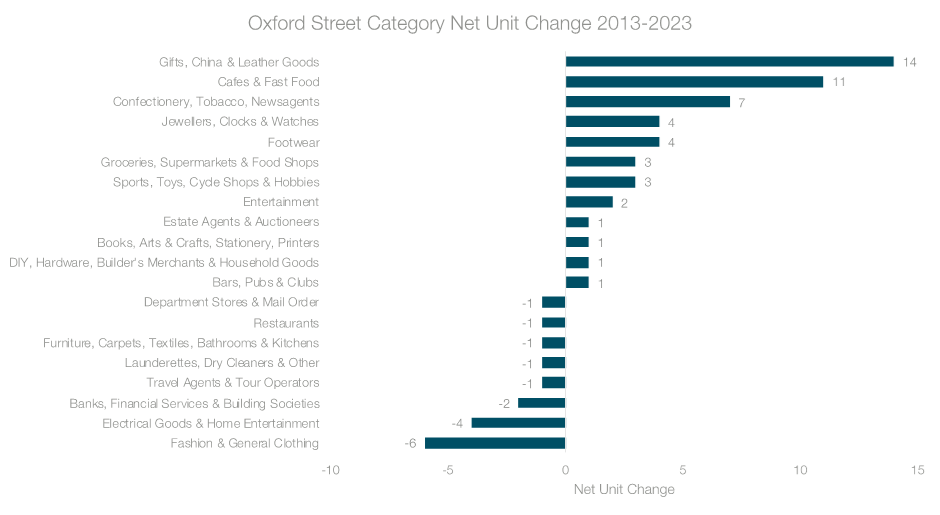
Figure 3: Net change in units for retail categories on Oxford Street, 2013-2023 (Source: Local Data Company)
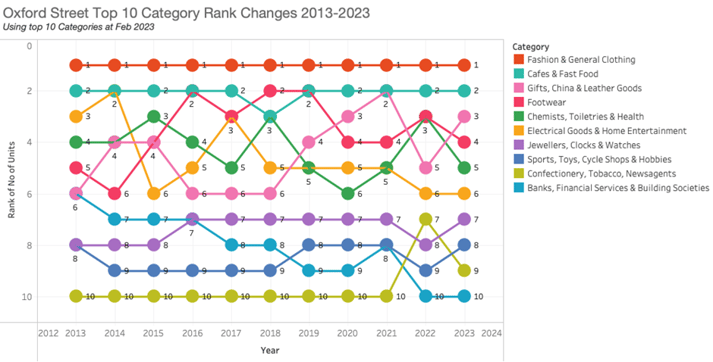
Figure 4: Changes in rank for the top 10 categories on Oxford Street, 2013-2023 (Source: Local Data Company)
Then:
Oxford Street’s international reputation as a fashion haven brought in swathes of shoppers from across the UK and the world. Major fashion and department store brand flagships were front and centre in the street’s retail offer, and shopping trips were supported by a strong provision of cafés and fast food for quick refreshment breaks.
The third most popular category in 2013 was electrical goods and home entertainment, with a strong provision of mobile phone and tech stores, and the HMV flagship store.
Now:
Fashion & general clothing has seen the biggest decline in store numbers with a net loss of -6 sites between 2013 and 2023. However, when ranking categories, it has maintained its position as the most prevalent category on the street since 2013. There has been a significant shift in business type mix within this category, however: in 2013, the mix of independent fashion & general clothing stores on Oxford Street was just 3%. Now, the mix sits at 17%.
Cafés and fast food saw a net increase of 11 units over the 10-year period, driven by an increase in independent occupiers. The category has maintained its position as having the second-highest number of stores on Oxford Street.
The gifts, china and leather goods category saw the highest growth in units between 2013 and 2023, with an increase of 14 sites over this period. This moved the category from 6th place in terms of store numbers in 2013, to third overall in 2023. The confectionery, tobacco and newsagents category also grew by a net 7 stores— these two categories combined account for the huge growth in candy, souvenir and vape shops.
The electrical goods and home entertainment category lost a net -4 sites on Oxford Street during this time. This was driven by the closures of many mobile phone shops and also the closure of HMV in 2019 (the site has since been reoccupied by an American candy shop). This category dropped from 3rd place for store numbers in 2013 to 6th in 2023.
What's next?
Oxford Street has been significantly impacted by COVID travel restrictions, the subdued return of office workers and the removal of the VAT-free shopping scheme. However, the street has reported strong turnover figures of late— fewer visitors, but higher levels of spend from those who do visit. The physical store launches of digital native and overseas brands in the area show further support for the street’s revitalisation. The opening of the Elizabeth Line at Bond Street and Tottenham Court Road has also expanded the domestic catchment.
The crackdown on candy shops continues, while the upcoming business rates revaluation could encourage more brands to debut or expand in Central London. It is hoped that one of the UK’s most recognisable shopping districts can continue to return to strength amid current challenges.

Author
Sarah Abu-Amero, LDC Marketing Executive
The Local Data Company
 901
901
901
901
Sarah joined LDC in 2021, having previously worked as a copywriter and social media manager. She supports the team with digital and written communication, planning and creating content for the company’s website and social accounts.