Latest analysis on the retail and leisure market over H1 2019 is out now!
Date published: Date modified: 2023-08-16

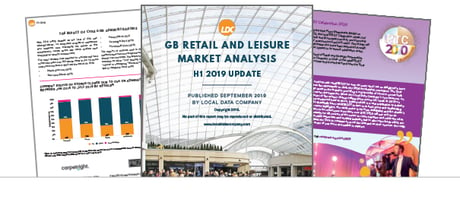
Today we released a new report which covers retail and leisure market trends across both the independent and multiple market for H1 2019.

Accordeon Image-2

INCLUDES

  • Vacancy rates across regions, location types and the GB average
  • Openings and closures trends across independent and multiple businesses and retail categories
  • Top 10 growing and declining retail categories
  • Early stage growth categories (categories with under 100 units which have been growing quickly)
  • Persistent vacancy trends 
  • The impact of CVAs and administrations on the market
  • A review of the increasing redevelopment of retail stock across the market
  • Guest consumer insights from market research agency, Mintel
  • Guest content from KPMG

KEY FINDINGS:

  • The Vacancy Rate for GB continued to rise to the highest level since the end of 2014, reaching 11.8%. This equated to a +0.6% rise year-on-year; up from the +0.2% year-on-year rise reported in H1 2018.
  • Activity levels (openings and closures combined) were up year-on-year. The number of openings rose the most at 12% in H1 2019 compared to H1 2018, rising from 19,803 to 22,115 in the 12-month period.
  • The total net change in retail and leisure units was -3,647 in H1 2019, an improvement on the -4,402 in H1 2018 at the height of the impact seen in this period by CVAs and administrations.
  • Independents performed better than Multiples in H1 2019 across all classifications. Independent Leisure and Service Retail categories especially saw growth with figures of +0.23% and +0.69% respectively.
  • All of the top 10 early stage growth categories for H1 are dominated by Leisure. Vegan restaurants continue to top the list, as they did in 2018 with a growth rate of 28.6% in H1.
  • Numbers of Fashion stores continue to fall with the three categories in the top 10 declining categories in H1 2019 (Fashion shops, Men’s Clothing and Women’s clothing) seeing a combined -285 net decline, higher than the Pubs and Estate Agents categories.
  • The Health & Beauty sector continues to thrive, with six of the top 10 growth areas occupied by these categories within the sector (Health Clubs, Alternative & Complementary Medicines, Barbers, Beauty Salons, Nail Salons and Hair & Beauty Salons)
     
    To download a free copy of the full analysis, click here.
     

Sarah Phillips, LDC Senior Manager- Marketing & PR
Author

Sarah Phillips, LDC Senior Manager- Marketing & PR The Local Data Company 901 901

Sarah joined the team in 2016 and is responsible for the management of all marketing channels for the Local Data Company. Having always worked in B2B, she brings with her varied experience in online and offline marketing including content marketing, events and digital. In her spare time Sarah enjoys theatre and comedy and can be seen jogging around the small Oxfordshire town she calls home.
Subscribe to our newsletter

For the latest insights, data and product news from across the Local Data Company group

Green Street, the parent company of LDC, is the preeminent and independent provider of actionable commercial real estate intelligence, covering the U.S. and Europe across nearly 20 property sectors including retail. Our comprehensive solutions include Research, Data & Analytics, News, and Advisory services.

Green Street UK is authorized and regulated by the Financial Conduct Authority (FRN 482269). Our global organization maintains information barriers to ensure the independence of and distinction between our non-regulated and regulated businesses.  Local Data Company is not a regulated Green Street business unit.

Copyright © 2024 The Local Data Company, 25 Maddox Street, London, W1S 2QN

Registered as a company in England & Wales 04821785 | VAT Registered No. 820601475