Press Release: LDC’s Top 10 Retail Trends in 2018
Date published: 2019-01-30 Date modified: 2020-02-03
Data released today by the Local Data Company reveals how GB high streets, shopping centres and retail parks changed over 2018.
- Over 2018, the GB vacancy rate rose from 11.2% to 11.5%. This is still much lower than in 2013 (12.6%).
- The leisure vacancy rate has been creeping up and is now at 8.5%, the highest in five years, due to the recent flurry of administrations and CVAs in casual dining.
- In 2018, there was an 18.8% year on year rise in the number of retail units which were either split in two, redeveloped for warehousing, office or residential use, or demolished.
- For the first time in recent years the total number of occupied units on retail parks declined, as some of the larger format stores tackled administrations or CVAs.
- Although it has one of the highest vacancy rates of all GB regions at 15.1%, the North West has seen the most significant improvement in vacancy rate in the last five years. This shows that the improvement initiatives that have been running across this region are working.
- For the second year in a row, Barbers (+813) and Beauty salons (+495) increased in number, indicating that the popularity of personal grooming continues to increase.
- Restaurant & Bars, Nail Salons and independent Coffee Shops also appear in the top 10 fastest growing categories for both 2017 and 2018.
- Supermarkets (+90) have made a reappearance into the top 10 growing categories, mainly due to Aldi's expansion and the roll-out of Iceland's The Food Warehouse.
- Banks saw the largest net decrease in numbers (-716) in 2018 as closures gathered pace, reflecting the massive change in how we ‘bank’ as well as increasing pressure from digital only banks such as Monzo.
- Estate Agents (-448) also saw increased losses as the market faced tough competition from online only agents and more importantly, Brexit uncertainty impacting the volume of transactions.
Lucy Stainton, Head of Retail and Strategic Partnerships at The Local Data Company commented:
“LDC’s latest figures prove that for better or worse, the structural transformation across the retail sector shows no sign of slowing or abating. In 2018 we tracked the GB vacancy rate increasing by 0.3% to 11.5%, driven predominantly by a decline in retail or service outlets which can be replicated digitally.
However, perhaps the most defining feature of 2018 is the first-time reversal of fortunes in the leisure space, this has largely been driven by a decline in the mid-market casual dining space. The key areas of growth across the last 12 months are very much skewed towards 'lifestyle' brands and offers including health clubs, restaurant / bar concepts, barber shops and beauty salons. This shows how consumers are continuing to be driven by newness and experience, presenting increasing challenges for more legacy operators.
Moving forward we predict the overall size of the physical retail and leisure market will continue to shrink as shown by the acceleration of retail stock changing to other uses such as office or residential space in 2018. However, we are also expecting to see a continued flurry of new entrants to the market across both the retail and leisure spaces, as new businesses seek to capture the consumers’ appetite for originality – albeit potentially to the continued detriment of existing operators who do not tweak and build on their concepts accordingly.”
Further detail on 2018 trends
Vacancy rates and numbers of units
- Over 2018, the GB vacancy rate increased back up to 11.5%, a rate last seen three years ago in December 2015.
- Within this, both retail and leisure vacancy rates have been creeping up, with the latter now at 8.5%, the highest in five years. This is due to a flurry of recent CVAs and administrations in the casual dining sector, including Prezzo, Byron, GBK, Carluccios and Jamie’s Italian, alongside a cautious market.
- Between 2017 and 2018, there was an 18.8% rise in the number of retail units (both live and vacant) which were either split into multiple units, redeveloped for warehousing, office or residential use, or demolished. This indicates the growing acceptance that there is too much retail stock in the market, resulting in a wave of innovation and creativity from landlords as they consider the best use of their assets.
GB historical vacancy rates from 2013 - 2019
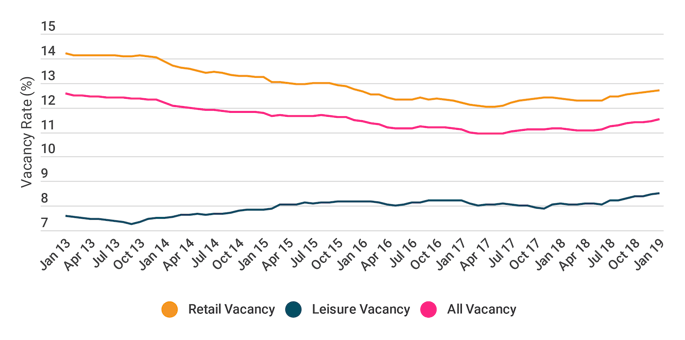
Figure 1: Historical GB Vacancy rate from 2013 – 2019. (Source: LDC)
- For the first time in recent years, the total number of occupied units on retail parks declined by 1.3%, as some of the larger format stores tackled administrations or CVAs.
- Place managers and landlords are increasingly optimising the amount of retail stock that is needed as the requirements of both retailers and consumers continue to evolve.
Regional trends
- Regional differences remain, with the North East (17.2%), North West (15.1%) and Wales (15.4%) having the highest vacancy rates.
- Although it is a region with one of the highest levels of vacancy, the North West has seen the most significant improvement in vacancy rate both in the last 5 years and the past 12 months as can be seen in Figure 2. This shows that the improvement initiatives that have been running across this region are working, such as the ‘Northern Powerhouse’ which has seen investment in both Manchester and Liverpool.
Regional changes to vacancy rates over 5 years and 12 months
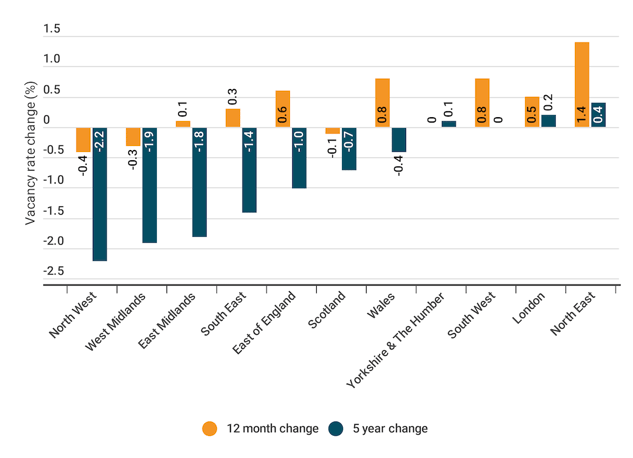
Figure 2: 12 month and 5 year change in regional vacancy rates across GB. (Source: LDC)
Retail categories which saw growth in numbers 2018
- For the past 2 years, Barbers (+813) and Beauty Salons (+495) have increased in number,indicating that the popularity of personal grooming continues to increase.
- The speed of growth of barbers has been increasing in recent years due to the ease of entry for new businesses. This includes the comparatively low investment for store fit-out and equipment, the lack of any accreditation to enter the market and the growing popularity for male grooming in the UK.
- This growing market is dominated by independent businesses, with 99% of barber stores independently run, but there are chains also growing in this space such as Headcase (+3 units), Mr Barbers (+7 units) and Ted’s Grooming Room (+3 units).
- Restaurant & Bars, Nail Salons and independent Coffee Shops (the Cafe and Tearoom category), all appear in the top 10 fastest growing categories for both 2017 and 2018.
- Supermarkets made a reappearance into the top 10, as they fight back against the discounters with competitive pricing and as well as Aldi and Lidl continuing to expand their networks with the former opening their 800th store in Q4 2018. The roll-out of Iceland's The Food Warehouse also added to this growth.
- In an interesting juxtaposition, increasing numbers of dessert parlours are coming into the market, while the popularity of 24-hour, low-cost gyms such as PureGym continues to gather pace alongside international brands and new concepts entering the market such as Mindset (Mental Health) and Flykick (Kick-boxing).
Top 10 growing retail categories in 2017
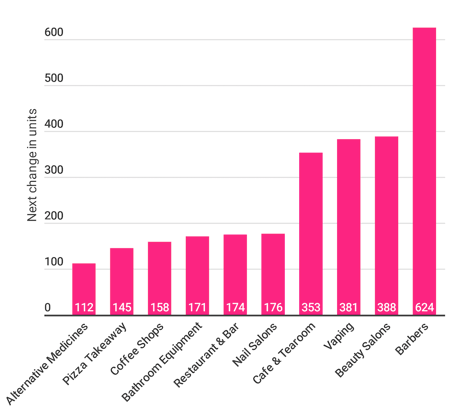
Figure 3: Top 10 growing retail categories by net increase in number of stores in 2017. (Source: LDC)
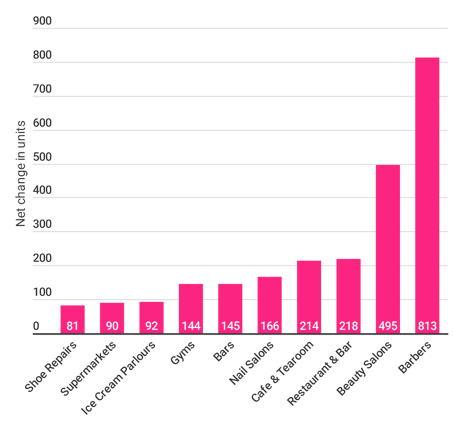
Figure 4: Top growing retail categories by net increase in number of stores in 2018. (Source: LDC)
Retail categories which saw decreases in numbers in 2018
- Banks took the number 1 spot for net decrease in numbers in 2018, as closures gathered pace, with banks investing in online services and mobile units. Santander announced they would be closing almost a fifth of their estate at the start of this year, with branch transactions dropping by 23% in the last three years, while digital transactions increased by 99% (Source: Santander). Banks are also facing increasing competition from the new breed of digital-only banks such as Monzo and Starling.
- Pubs saw the largest decrease in 2017 and the second largest in 2018, losing 1,383 units over two years.
- Electrical goods entered into the top 10 in 2018, due in part to the closure of Maplin stores after its administration.
- Numbers of Discount stores declined in 2018, mainly due to Poundworld’s administration in the summer. Some discounters saw stronger growth figures with B&M Bargains leading the pack as they continued to expand across GB.
- Estate Agents saw a rise in closures as the market faced increasing competition from online-only agents, alongside an increase in stamp duty for foreign buyers and most importantly, Brexit uncertainty impacting the volume of transactions.
Top 10 declining retail categories in 2017
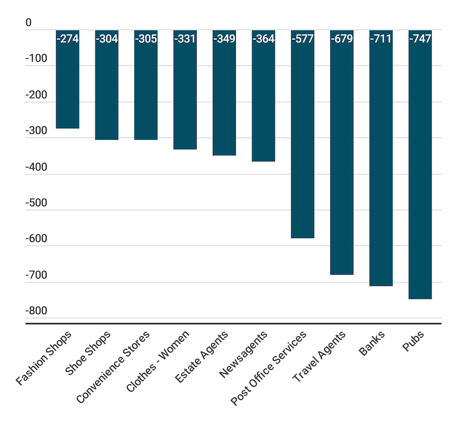
Figure 5: Top 10 declining retail categories by net decrease in numbers in 2017. (Source: LDC)
Top 10 declining retail categories in 2018
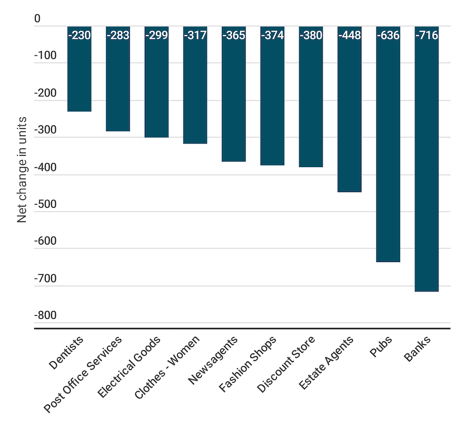
Figure 5: Top 10 declining retail categories by net decrease in numbers in 2018. (Source: LDC)
ENDS

Author
Sarah Phillips, LDC Senior Manager- Marketing & PR
The Local Data Company
 901
901
901
901
Sarah joined the team in 2016 and is responsible for the management of all marketing channels for the Local Data Company. Having always worked in B2B, she brings with her varied experience in online and offline marketing including content marketing, events and digital. In her spare time Sarah enjoys theatre and comedy and can be seen jogging around the small Oxfordshire town she calls home.