After a short hiatus, the Local Data Company field research team returned to the field on the 23rd May and since have been working on a specific project to capture the immediate impact of the pandemic in the UK.
During a six-week intensive research period, the team collected data on 111,000 units (representing 17% of the entire GB market) across strategically selected locations in order to cover a sample of the market which is as representative of the entire country as possible.
The research framework was designed to cover a representative percentage of independent/multiple businesses, retail categories, town sizes and regions. Researchers were given clear guidance to determine whether a unit was closed due to covid, trading in some capacity or had been vacated and was lying empty.
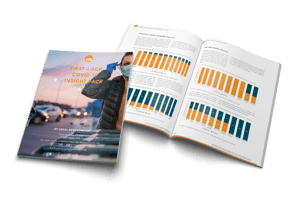
The result of this work has been assimilated and analysed as a special insights pack which sets out the first part of the retail recovery story detailing reopening trends across retail categories, location types and regions.

The results are reflective of the significant challenges facing the market and the anticipated transformation that will happen as a result over the coming months. We continue to be at the forefront of reporting as we track this change in close to real-time. This data pack provides quantified analysis and data to support current hypotheses about the market and ongoing strategic planning.
This first-look covid insight pack is available now for non-clients to purchase at a fee of £1,750.
The Local Data Company is pledging 20% of the revenue from this insight pack to the CaRe20 campaign, run by retailTRUST which has been set up to support store colleagues and their families, who are facing financial distress as a result of the COVID-19 pandemic.
Please click here to request a copy

more detail on the methodology can be found below:
This report considers non-essential retail, excluding essential retail categories that did not close during lockdown. The subcategory analysis in this report focuses on retail categories that had at least a sample size of at least 50 units that had been visited in the survey period, to avoid bias and ensure analysis could be completed on a representative sample of the market.
A research framework detailed below was designed to ensure representative coverage across English regions, business types and retail categories in order to give a reasonable representation of the national picture.
- Coverage of 17% of the GB retail landscape including towns and cities of varying sizes (average across all visited towns was 637 units) the largest being Sheffield (5,684 units) and one of the smallest being Jarrow (88 units).
- 59% of the surveyed premises were independent businesses, while 41% were national chains, reflective of the GB total ratio of 64% independent and 36% multiple.
- The retail mix of the sample was designed to reflect GB averages as closely as possible, with each classification represented to within 2% of the national average.
|
Retail Mix
|
Sample Market
|
GB
|
|
Comparison
|
29%
|
27%
|
|
Convenience
|
13%
|
13%
|
|
Leisure
|
26%
|
25%
|
|
Service
|
31%
|
29%
|
- Regional representation covered English regions well. However, Scotland and Wales were slightly underrepresented due to the slower relaxation of lockdown measures in these nations. However, the percentage of records in the sample data for each region was within 3% of the total which enabled us to gain representation across GB.
|
Region
|
Sample records
|
All Records
|
|
East Midlands
|
4%
|
7%
|
|
East Of England
|
9%
|
8%
|
|
Greater London
|
18%
|
18%
|
|
North East
|
5%
|
4%
|
|
North West
|
12%
|
12%
|
|
Scotland
|
7%
|
9%
|
|
South East
|
16%
|
13%
|
|
South West
|
6%
|
9%
|
|
Wales
|
1%
|
4%
|
|
West Midlands
|
10%
|
8%
|
|
Yorkshire and the Humber
|
11%
|
9%
|
For more information on the report or the methodology please contact team@localdatacompany.com.

 901
901
901
901

